Monthly Archives: February 2019

Assignment 4 – Intro to modeling and normalization

Due date: Mar 5, 2019

Introduction

  • In this exercise you’ll be working with the two readings posted on the library’s e-reserve page that were assigned for this class.
  • This exercise is worth 6 points. Part I is worth 3 points and Part II is worth 3 points.
  • As this assignment does not require SQL statements, the normal SQL submission guidelines do not apply. You can submit the responses in MS Word format.

Part I – ER Diagram

Read and refer to the Entity Relationship Model article by Song and Chen to answer the following questions. These three questions all refer to figure 3, which depicts a model for a company.

chen_erm
Image source: Song & Chen, Encyclopedia of Database Systems, 2009

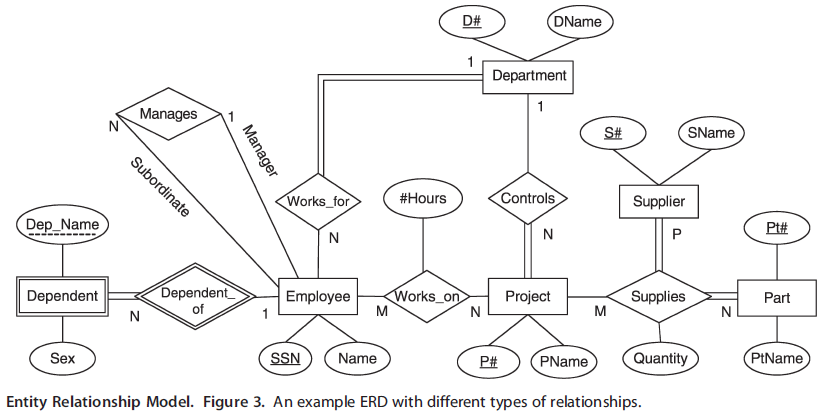
In figure 3 on page 1006, the relationship between the dependent (spouse or child of an employee) and employee is indicated by the relationship diamond “Dependent of”. Cardinality (direction of the relationship) is a one to many relationship as indicated by the number 1 for the dependent and letter N for employee. Participation is indicated by the lines that connect each entity to the relationship. The double lines from dependent indicate mandatory participation, while the single line from employee indicates optional participation. Thus, the relationship can be described:

A dependent is a dependent of an employee, because they receive health benefits through the employee. Dependents can only have one employee, because they can’t receive benefits from multiple people. Each dependent must have one employee, because they cannot receive benefits from the company if no family member works there. An employee may have many dependents, but does not have to have a dependent because they may have no immediate family members.

1. Based on this example, describe the relationship that exists between the employee and department entity. Model your answer on the quoted text above and address: what the relationship is, the logic behind it, cardinality, and participation. Use your imagination to express the logic behind the relationship, for example the reasons why an employee may or may not be assigned to a department.

2. Similar to question 1, describe the relationship that exists between the employee and project entity. Model your answer on the quoted text above and addresses: what the relationship is, the logic behind it, cardinality, and participation. Make sure to address the logic behind the realtionship.

3. The diagram has a department entity. Imagine you have to extend this model by adding an office entity, which represents distinct physical locations where all departments are located (based on the example below). Describe the relationship, cardinality, and participation between the department and office entity. In addition, provide two attributes that could be associated with the office entity.

  • Department – Office
  • Administration – New York Office
  • Accounting – New York Office
  • Sales – New York Office
  • R & D – New Brunswick Office
  • Human Resources – New York Office
  • Manufacturing – Allentown Office
  • Shipping – Allentown Office

Part II – Normalization

4-6. Referring to the slides and the article by Kreibich, take the following data on dependent territories (areas that are not independent countries but are controlled by other sovereign nations) and put it into 1st, then 2nd, then 3rd normal form. The region and continent indicate where the dependency is located (these are part of a hierarchical scheme the United Nations uses for classifying countries; regions fall within continents). Columns that begin with a ‘T’ refer to the territory while columns beginning with an ‘S’ refer to the sovereign nation that controls the territory.

Show each step of the transformation just as it’s demonstrated in the slides (1st, then 2nd, then 3rd), where the tabular outcome of each normalization phase is shown. Do not conflate any of the forms. You can copy and paste the table into Word, and use Word’s table functions to display each one, and under each result write one to two sentences describing what you did.

Territory Tcapital Tpop Tregion Tcontinent Sid Sovereign Scapital
Falkland Islands (FLK) Stanley 2,931 South America Americas GBR United Kingdom London
Faroe Islands (FRO) Torshavn 49,188 Northern Europe Europe DNK Denmark Copenhagen
Falkland Islands (FLK) Stanley 2,931 South America Americas GBR United Kingdom London
French Polynesia (PYF) Papeete 285,735 Polynesia Oceania FRA France Paris
Gibraltar (GIB) Gibraltar 29,328 Southern Europe Europe GBR United Kingdom London
Greenland (GRL) Nuuk 56,483 Northern America Americas DNK Denmark Copenhagen
Guam (GUM) Hagatna 162,742 Micronesia Oceania USA United States Washington DC
Guernsey (GGY) St Peter Port 63,026 Northern Europe Europe GBR United Kingdom London

Assignment 3 – Intro to SQL: Data Definition Language (DDL)

Due date: Feb 26, 2019

Introduction

  • In this exercise you’ll be working in the nyc and nys schemas within the gep664_2019 database.
  • This exercise is worth 7 points. Each question is work 1/2 a point, except the final question which is worth 1 point.
  • Be sure to follow the proper conventions for SQL statements and the guidelines for submitting assignments, as documented in the SQL Homework Guidelines. Failure to do so will result in point deductions.

For the following, provide the SQL statement that answers each question; provide the row count only if asked. There may be more than one way to answer certain questions (just choose one).

Part I – Weather Stations table (nyc schema)

In order to select weather stations by state, we currently have to use the LIKE statement to do pattern searching. This is extremely inefficient; let’s add a dedicated state column that will allow for more efficient queries.

1. Alter the weather stations table by adding a column called state that will hold the two-letter state code (i.e. NY, NJ).

2. Update the new state column by adding the two letter state code that indicates where the station is located. You can do this using either one or two statements.

Part II – NYC Borough Data (nyc schema)

You’ll get some practice in table creation by adding a couple of tables with data for the five boroughs of NYC. Each of the boroughs is also considered a county; a borough is a local designation for subdivisions of the City of New York, while counties are a federal designation for subdivisions of states.

3. Create a table called nyc.boroughs_area to hold the following data: codes and names for the boroughs, and their area in water and land in square miles (for column names, use the names in question 4). Designate a primary key, specify that borough names should not be null, and add a check constraint that land area must be greater than zero.

4. Insert the data into the new table with an INSERT INTO VALUES statement.

bcode,bname,area_wtr,area_lnd
bx,Bronx,15.38,42.10
bk,Brooklyn,26.10,70.82
mn,Manhattan,10.76,22.83
qn,Queens,69.68,108.53
si,Staten Island,43.92,58.37

5. Create a view called nyc.boroughs_sum that has the borough name and calculated fields that have the total land area, the percent total that is water, and the percent total that is land. Optionally – you can round the percentages to whole numbers.

6. Create a table called nyc.counties_pop to hold the county code, county name, borough code, and population for 2010 (for column names, use the names in question 7). Make county code the primary key and borough code the foreign key.

7. Insert the data into the new table with an INSERT INTO VALUES statement.

ccode,cname,bcode,pop2010
36005,Bronx County,bx,1385108
36047,Kings County,bk,2504700
36061,New York County,mn,1585873
36081,Queens County,qn,2230722
36085,Richmond County,si,468730

8. Create a new table called nyc.boroughs_pop with data from the borough area and county population tables that contains: the borough code as primary key, borough name, total population, and population density (land area divided by population).

Part III – Import Labor Force Table (nys schema)

We’ll import a table from the Census 2012-2016 American Community Survey that indicates whether resident workers in a county work in the same municipality in which they live. There is one record for each county in New York State, and like the previous ACS tables we’ve worked with each estimate column has a margin of error (me) column associated with it (for this exercise you can ignore the me columns).

Go to the Data & Software tab on the course website and download the homework data for Class 3, which is a CSV file for place of work by MCD of residence. This CSV has a header row and uses commas for delimiters.

9. In the nys schema create a table called nys.resworkers_mcd that will accommodate all of the data in the CSV file. Make sure to designate a primary key.

10. Use pgAdmin to insert the data from the CSV file into the table. Once it’s imported, write a basic select statement to select all the records to verify the result. Then write a second statement that returns all the counties where the number of workers who work in their MCD is greater than the number that work outside their MCD. In your answer provide both SELECT statements and the number of rows returned (via the Messages tab in pgAdmin).

Part IV – Written Responses

Please answer the following questions in two to four sentences.

11. What is the difference between a primary key and a foreign key?

12. What is a view and how is it different from a table? For what purpose would you create a view?

13. Imagine you have a data table with population data for places, which is a US Census term for cities and towns. The data includes: a 5-digit code that contains digits from 0 to 9 that uniquely identifies each place, a place name, the two-letter state abbreviation, a footnote that indicates whether a place is incorporated or not, the total area in square miles with two decimal places, the 2010 census population count, and a 2017 population estimate. Write a CREATE TABLE statement for this data, paying attention to best practices for creating names, assigning data types, and building well structured tables. Then, write a few sentences describing your rationale for creating the table the way that you did.

Assignment 2 – Intro to SQL: Data Manipulation Language (DML)

Due date: Feb 12, 2019

Introduction

  • In this exercise you’ll be working in the nys schema within the gep664_2019 database.
  • This exercise is worth 7 points. Each question is worth 1/2 a point.
  • Be sure to follow the proper conventions for SQL statements and the guidelines for submitting assignments, as documented in the SQL Homework Guidelines. Failure to do so will result in point deductions.

Background

In this exercise you’ll be working in the nys schema within the gep664_2019 database. This schema includes four tables with county-level census data that describe the economy and labor force in NY State.

metadata
a description of every column for every table in this schema
metros
counties that are part of metropolitan areas that fall within NY State
popworkers
number of residents (population) and number of workers who work in the county from the 2012-2016 American Community Survey
resworkers
number of workers who live in the county and their place of work from the 2012-2016 American Community Survey

In pgAdmin 4 you can select each table and view the Properties tab for more information about the data. Read this information, view the metadata table, and examine each of the tables prior to beginning the exercise.

“Residents” are the total population of an area. “Workers” are the number of people that work in an area regardless of where they live. Both of these variables are in the popworkers table. “Resident Workers” are the population of the area who work, regardless of where they work. The resworkers table provides information on where resident workers work: inside or outside their state of residence, and inside or outside their county of residence. The data in these tables can be used to calculate the daytime population for an area, i.e. where most people are during the day based on their residency and work status.

Metropolitan areas are defined by the US Office of Management and Budget and are used by many federal agencies, including the Census Bureau. Metro areas consist of one or more adjacent counties that meet certain thresholds for total population and density, and that are linked by commuting patterns. Metro areas can cross state boundaries, and are subdivided between large areas (called Metropolitan Areas) and smaller areas (called Micropolitan areas). Core Based Statistical Area (CBSA) is an umbrella term that includes both areas, while the term “Metro Area” is also used colloquially to refer to both.

Questions

For the following, provide the SQL statement and the record count that is automatically returned by pgAdmin (flip from the Data Output tab to the Messages tab to see the count) or psql. There may be more than one way to answer certain questions (just choose one).

Part I – Popworkers Table

1. Select all columns for all counties that have less than 50000 residents.

2. Select the id, name, and residents columns for the two Long Island counties (Nassau and Suffolk).

3. Select the id, name, residents, and workers columns, calculate the difference between residents and workers in a calculated field called difference, and sort the data by difference in descending order (largest to smallest).

4. Summarize the entire table: count the total number of counties, sum the total number of residents, and sum the total number of workers for all counties.

Part II – Resworkers Table

5. For all counties, return ids, names, resident workers, and workers who work in their county of residence, and create a calculated field that shows the percentage of resident workers who work in their county of residence. Sort the result by the calculated field in ascending order (smallest to largest), and limit the result to display the bottom ten counties (smallest values). Since these columns are integers and you need a decimal result, use the cast operator:

(CAST(column1 as numeric) / CAST(column2 as numeric))*100

6. Do a regular inner join on the resworkers and popworkers table using their id. Create a field where you calculate the daytime population (residents + workers – resident workers). Your result should just include columns that are relevant to the calculation. Create a second calculated field that’s the difference between this daytime population and the resident population, and sort by this value.

Part III – Metro Table

7. Return a list of all the distinct cbsas from the metro table and sort them in alphabetical order.

8. Select all columns and records in the metro table that are not within New York State (these are counties that are outside of NY State but are inside a metro area that’s within NY State).

9. Write a query that counts the number of counties in each cbsa.

10. Do a regular inner join between the popworkers and the metro tables to show which counties are part of which cbsas. Include ids, names, and total residents in the result. Sort by metro area name and county name.

11. Do a left outer join with popworkers on the left to illustrate which NY counties are not part of a cbsa. Include ids, names, and total residents in the result.

12. Do a regular inner join between the popworkers and metro table and summarize the number of residents and workers by cbsa. Sort the data by population in descending order and only include columns that are relevant.

Part IV – Written Responses

Please answer the following questions in two to four sentences.

13. What are the benefits for using aliases (with the AS statement) for column names and table names?

14. What is the difference between a regular (inner) join and a left-outer join? For what purpose would you use a left-outer join?